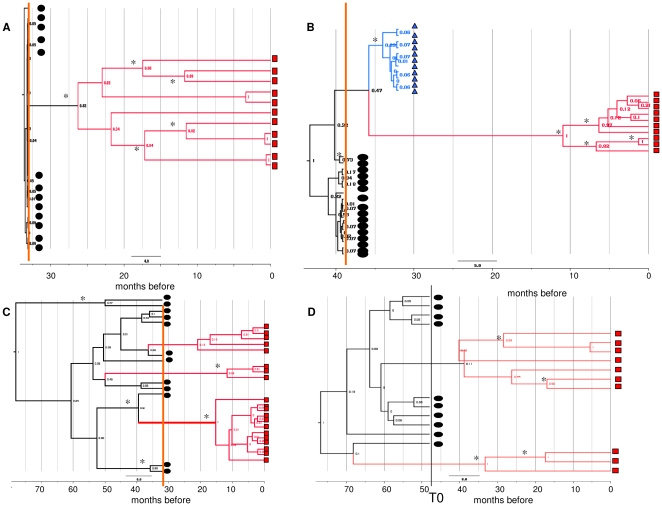
Figure 2. Bayesian phylogenetic trees of the HCV E1/E2 sequences at different times during follow-up.
Four exemplary trees obtained from two immunological responders to HAART: subject #5 (A); subject #4 (B), one non-responder: subject #7 (C), and one patient not receiving HAART: subject #9 (D). The clones isolated in the basal, intermediate and/or last samples are indicated by black circles, blue triangles and red squares, respectively. The other trees are shown in Supporting Figure 1 (Figure S1). The branches are shown in units of time, and the numbers on the branches indicate posterior probabilities. Asterisks indicate significant branches (pp>0.65). The months before the last sample are shown in the scale at the bottom of the trees. The vertical line indicates time of HAART initiation (orange line) or T0 (black line).

