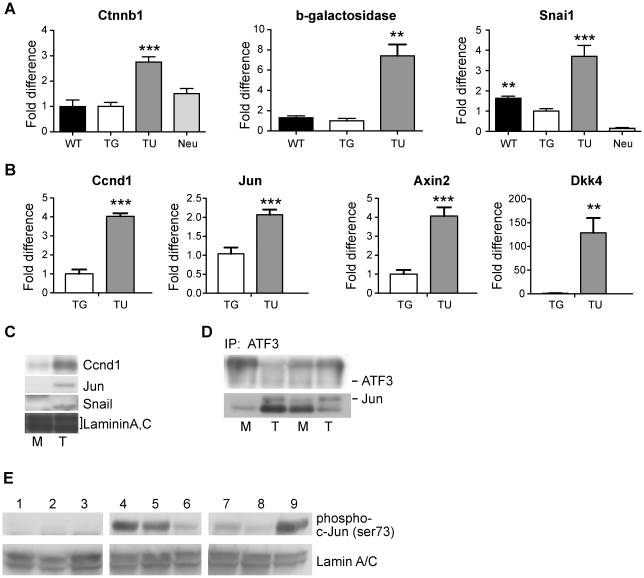
Figure 2. Expression analysis of Wnt/β-catenin pathway genes.
Gene expression analysis was performed as described in Materials and Methods by quantitative real-time PCR for: A, Ctnnb1, bacterial β-galactosidase, Snai1; and B, Ccnd1, Jun, Axin2, and Dkk4. WT, mammary glands from non-transgenic mice; TG, mammary glands from BK5.ATF3 mice; TU, mammary tumors from BK5. ATF3 mice; Neu, mammary tumors from MMTV.neu mice. The mean and standard deviation of relative expression levels for at least 5 individual mice are shown; for all genes the mean expression level obtained with BK5.ATF3 mammary glands was set to 1.0. The statistical significance of differences between mean expression levels, calculated relative to BK5.ATF3 mammary glands, is indicated over the bars of the histograms: *, p<0.05; **, p<0.01; ***, p<0.001. C, immunoblots from a representative BK5.ATF3 mammary gland extract (M) and a mammary tumor (T) are shown for Cyclin D1, Jun and Snail; laminin A,C is shown as a protein loading control. D, extracts from paired mammary gland and tumor samples were immunoprecipitated with antibody to ATF3, then electrophoresed and immunoblotted for ATF3 and Jun. E, immunoblots of nuclear extracts from non-transgenic mammary glands (lanes 1–3), BK5.ATF3 transgenic mammary glands (lanes 4–6) or BK5.ATF3 mammary tumors (lanes 7–9) were prepared with a phospho-serine 73-Jun specific antibody; all lanes are from a single representative gel.

