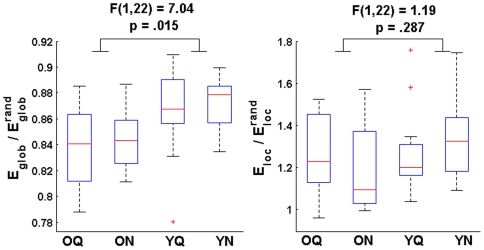
Figure 3. Aging and listening condition effects on whole-cortex network measures.
To test for effects of group and listening condition on the normalized weighted graph measures, summary values of  and
and  were obtained by averaging the measures across the entire cost curves for each subject and listening condition. A significant effect of group on (cost-averaged)
  was found (Younger>Older; see left panel). The effect of group on (cost-averaged)
  was not significant (right panel). No significant condition or group x condition interaction effects were found. Box plots indicate median, interquartile range, and minimum and maximum values of network measures across all subjects for each age group and listening condition.

