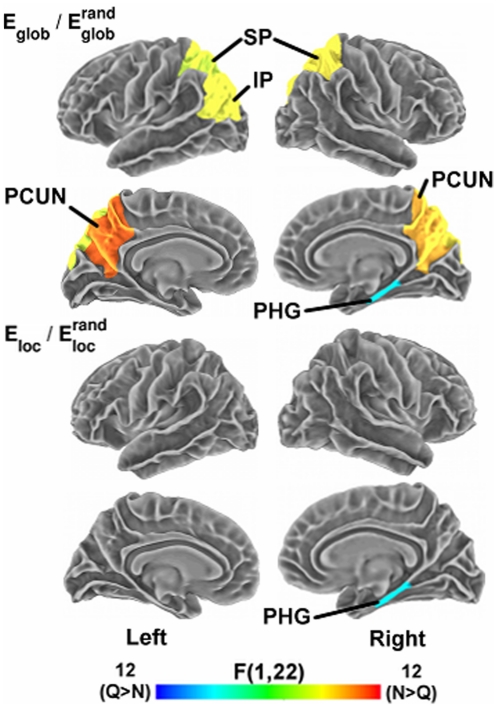
Figure 5. Listening condition effects on regional network measures.
Surface maps display cortical regions showing a significant main effect (p<.05, uncorrected) of listening condition (quiet vs. noisy) on regional network measures of  (top panels) and
  (bottom panels). The color bar indicates direction and magnitude of the main effect of listening condition on network measures (red: noisy>quiet; blue: quiet>noisy).

