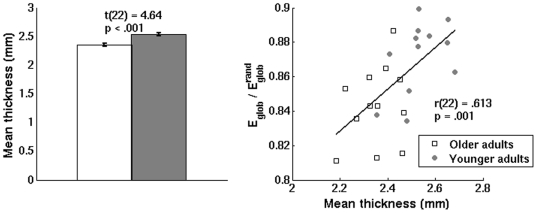
Figure 7. Association between mean cortical thickness and  .
.
Left panel: Younger adults exhibited increased mean cortical thickness relative to older adults. Error bars indicate the standard error of the mean. Right panel: Across younger and older adults, a significant correlation was found between mean cortical thickness and average  . Presented data are from networks obtained from the noisy listening condition.

