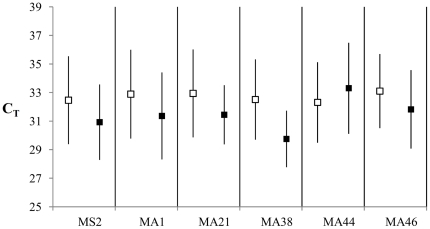
Figure 3. Dropout and CT.
Graphical representation of differences in average CT values in extracts with allelic dropout (empty boxes) and extracts with no dropout (black boxes). Higher CT values are accompanied by higher chance of dropout in five of the six markers. Exact values are listed in Table 3.

