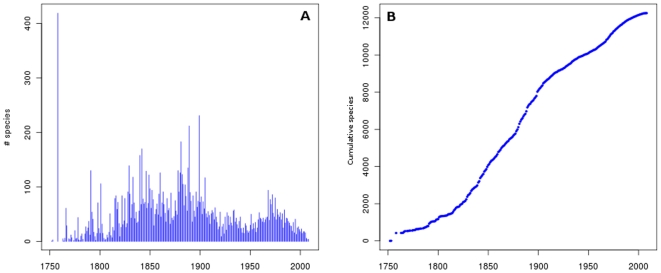
Figure 11. Species description in South America.
A: Number of species described per year for all taxonomic groups. B: Species-description accumulation curves for marine species taking into account all taxonomic groups. Period: 1750–2000. Data from OBIS database (using only “valid names” which corrects for synonyms).

