
Figure 2.
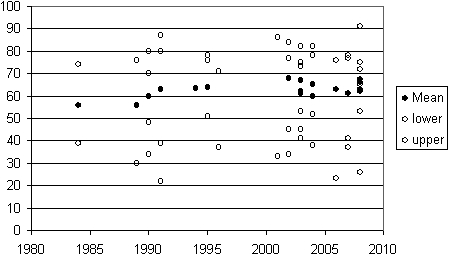
Patient age over time. For publications where the age in years (vertical axis) of operated patients is provided (mean age for 16 studies and the range in 23). The data are plotted against the year of publication
Official websites use .gov
A
.gov website belongs to an official
government organization in the United States.
Secure .gov websites use HTTPS
A lock (
) or https:// means you've safely
connected to the .gov website. Share sensitive
information only on official, secure websites.
Patient age over time. For publications where the age in years (vertical axis) of operated patients is provided (mean age for 16 studies and the range in 23). The data are plotted against the year of publication