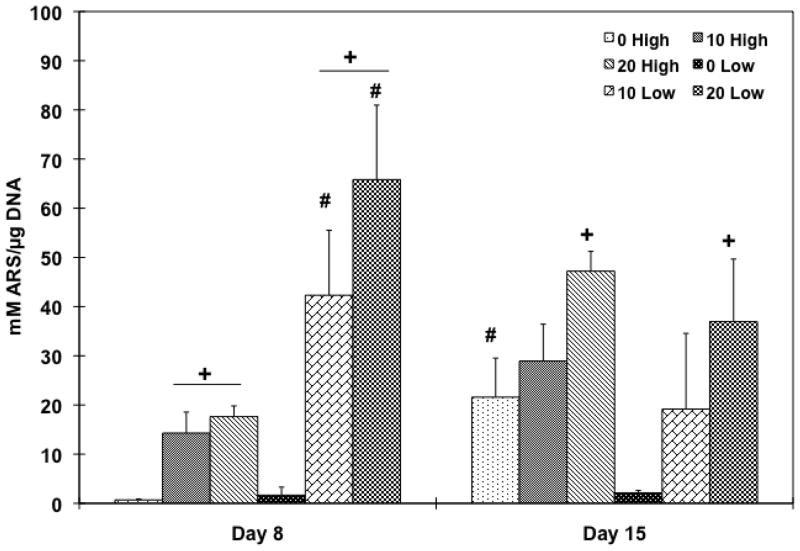
Figure 9.
Quantitative mineralization assay by alizarin red S staining on day 8 and 15. Calcium deposition level was normalized by DNA amount and average ± standard deviation (n=3 per group) is reported. + indicates a statistical difference in HA amount within same cell seeding density group while # indicates a statistical difference in cell seeding density groups with the same HA concentration group (p<0.05).

