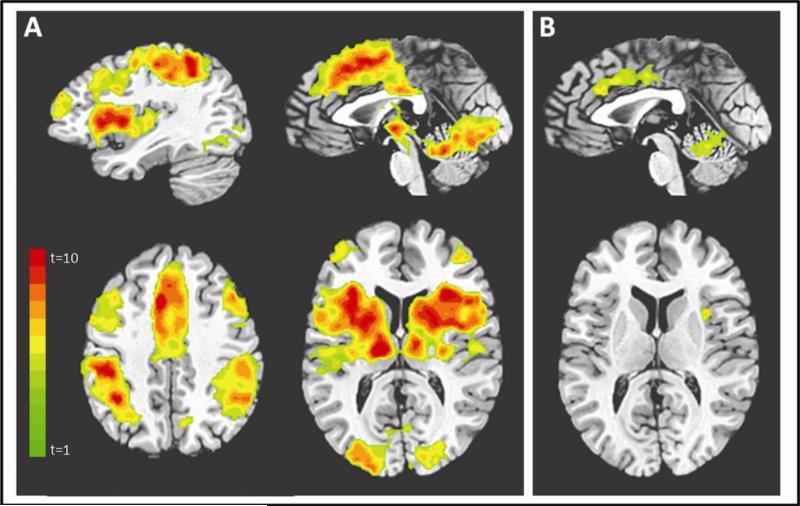
Figure 3.
Study 2: Effects of shock anticipation on neural responses for (A) the contrast shock anticipation > safe (starting top left and moving clockwise, slices are displayed at x=36, x=0, z=40 , z=11) and (B) the conjunction analysis with strong shock anticipation > medium shock anticipation (top slice is displayed at x=0, bottom slice at z=11). Contrasts displayed at corrected p<.05, t=3.5, color bar indicates t statistic. Coordinates for all regions showing a main effect of shock anticipation are displayed in Table 1.

