Figure 4.
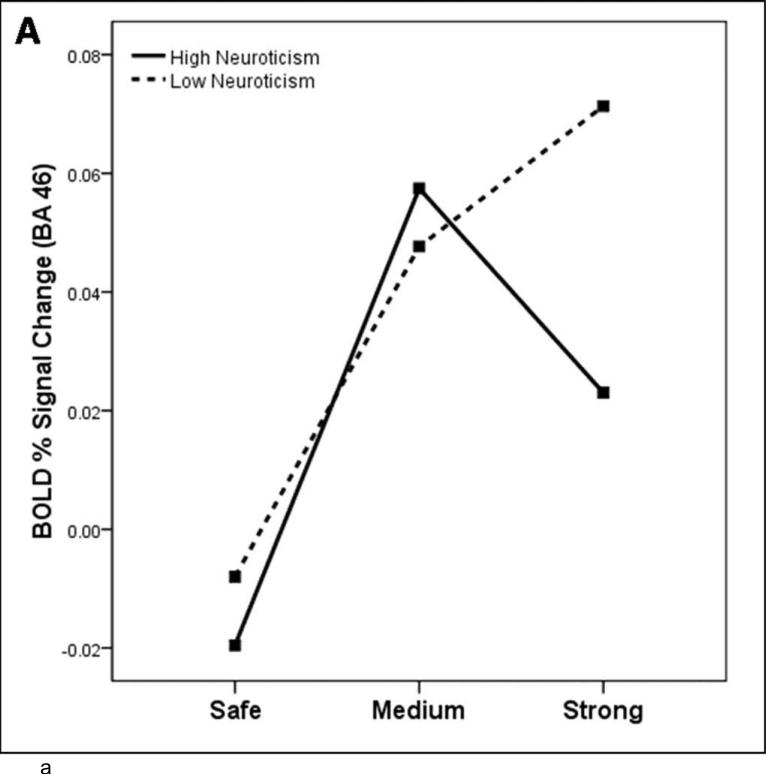
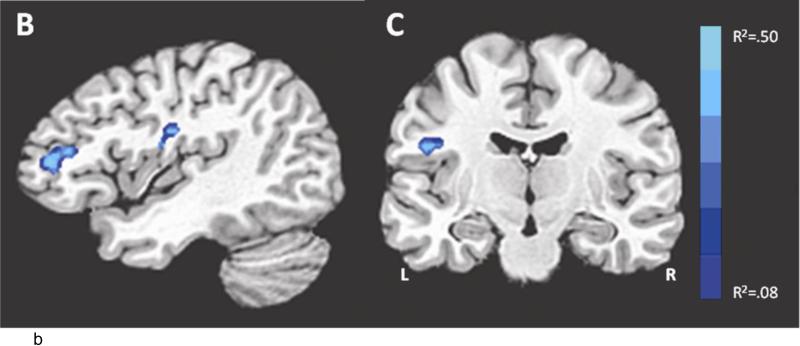
Study 2: Neural response to threat varies as a function of neuroticism. (A) the relationship between BOLD response to each condition and neuroticism (median split) in right BA 46 (brain slice depicted in (B), the contrast strong shock anticipation > medium shock anticipation). Regions which correlate with neuroticism for the contrast strong shock anticipation > medium shock anticipation, using a whole-brain regression at corrected p < .05, T=3.5, color bar indicates R2 value: (B) right BA 46 (anterior cluster; x=-3, y=-4, z=53), (C) right insula (x=45, y=13, z=22). Coordinates for regions showing a significant correlation with neuroticism are displayed in Table 2.


