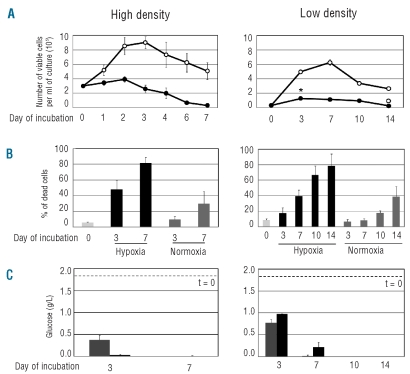
Figure 1.
Effects of hypoxia on cell number and viability and glucose concentration in cultures established at different time 0 cell densities. Exponentially growing K562 cells from routine cultures were replated in fresh medium at 3x10⁵ (left graphs) or 3x10⁴ (right graphs) cells/mL and incubated in normoxia (21% O2) or hypoxia (0.1% O2) for the indicated times. (A) Time-course of the number of viable cells, as determined by trypan blue exclusion; ○: normoxia; ●: hypoxia. Values are means ± S.E.M. of data from 6 independent experiments; the differences between time 0 and day 3 (*; P<0.005) and between day 10 and day 14 (°; P<0.01) were statistically significant. (B) Time-course of the percentage of dead cells, as determined by flow-cytometry of cells stained with propidium iodide (PI) and fluo-resceinated anti-annexin V (aV) antibody. Histograms represent the total percentage of apoptotic plus dead cells (sum of the percentages of aV-positive/PI-negative, aV-negative/PI-positive, double-positive cells). Light gray: time 0; dark gray: normoxia; black: hypoxia. Values are means ± S.E.M. of data from 4 independent experiments. (C) Time-course of glucose concentration in culture medium. Gray: normoxia; black: hypoxia. Dashed lines: time 0 concentration. Values are means ± S.E.M. of data from 3 independent experiments.

