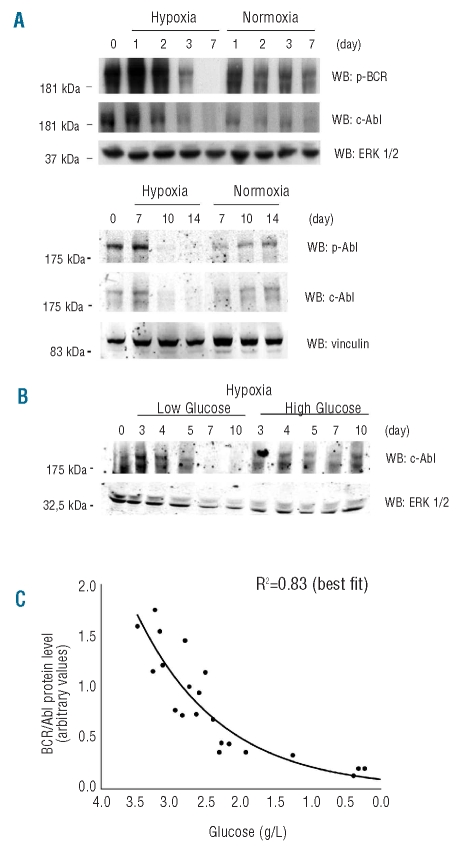
Figure 3.
Effects of time 0 cell density or glucose concentration on the time-course of BCR/Ablprotein expression in normoxia or hypoxia. (A, B) K562 cells were plated at 3x10⁵ (A, higher panel) or 3x10⁴ (A, lower panel; B) cells/mL in medium containing standard or low/high (B) glucose concentrations (2, 1 or 4.5 g/L, respectively) and incubated in hypoxia or normoxia (A) or in hypoxia (B) for the indicated times. Total cell lysates were subjected to SDS-PAGE and electroblotting, and proteins revealed using the indicated antibodies. Equalization of protein loading was verified by anti-ERK1/2 or anti-vinculin immunoblotting. For each panel, one representative experiment out of 3 with similar outcome is shown. (C) Relationship between glucose concentration in culture medium and BCR/Ablprotein expression in hypoxic cultures of A and B and of 2 additional, independent experiments. The densitometric values of BCR/Ablprotein bands in cell lysates were plotted in function of glucose concentration in the corresponding culture, irrespective of cell or glucose concentration at time 0 and of incubation time. Only values corresponding to cultures where glucose concentration was reliably detectable (>0.2 g/L) were considered. Values were normalized for the densitometric values of bands used to check equalization of protein loading. The interpolating curve was obtained by best fit and the relative R2 value is reported.

