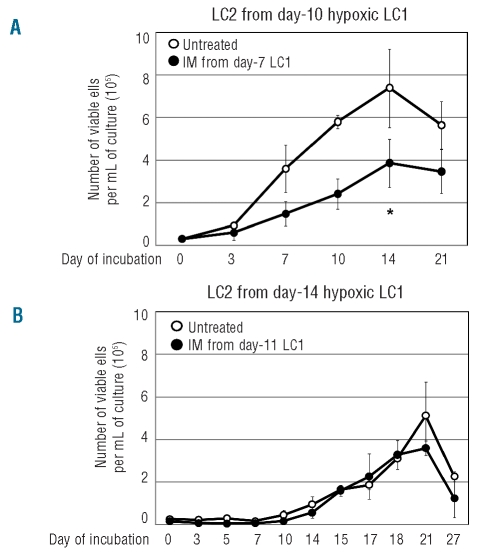
Figure 5.
Effects of imatinib-mesylate (IM) on CRA of cells incubated in hypoxia. Time-courses of the number of viable cells in normoxic LC2 established with cells treated or not with IM 0.5 μM during incubation in hypoxic LC1. LC1 established with 3x10⁴ K562 cells/mL and standard glucose concentration were treated with IM (●) or not (○) from day 7 to day 10 (A) or from day 11 to day 14 (B) and cells then replated at 3x10⁴ cells/mL in LC2 to be incubated in normoxia for the indicated times. Values are means ± S.E.M. of data from 3 independent experiments. In (A), the difference at day 14 between IM-treated and control cultures was statistically significant (*; P<0.05).

