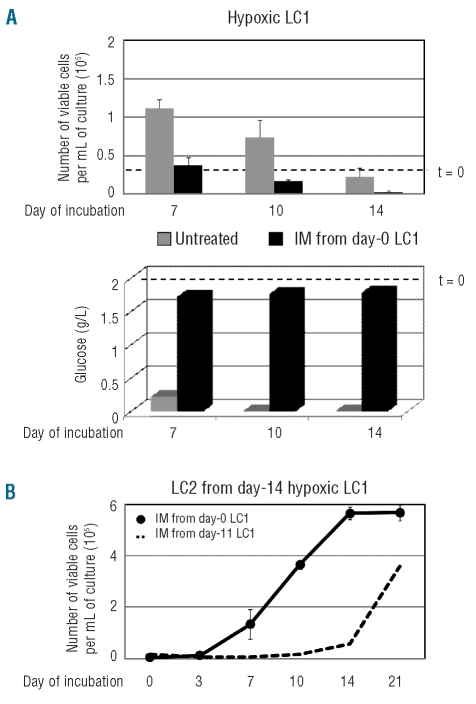
Figure 6.
Effects of IM administered to cells before their incubation in hypoxia. (A) Time-courses of the number of viable cells (upper graph) or glucose concentration in culture medium (lower graph) in hypoxic LC1 established with 3x10⁴ K562 cells/mL and standard glucose concentration, incubated in the absence (gray) or the presence (black) of IM 0.5 μM from time 0. Values are means ± S.E.M. of data from 3 independent experiments (upper graph) or from a single, representative experiment (lower graph). Dashed lines correspond to time 0 values. (B) Time-course of the number of viable cells in normoxic LC2 (CRA) established with 3x10⁴ K562 cells/mL rescued at day 14 from the above LC1 treated with IM from time 0 (●). Values are means ± S.E.M. of data from 3 independent experiments. Dashed line corresponds to the repopulation kinetics of LC2 established with cells rescued at day 14 from hypoxic LC1 treated with IM from day 11 to day 14 of incubation (see Figure 5B).

