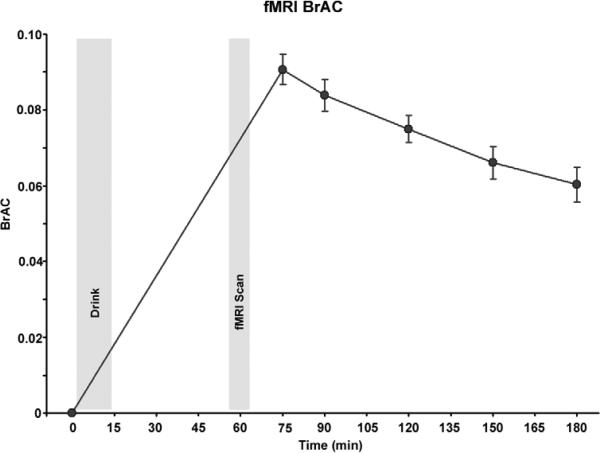
Figure 1.
Alcohol effects on breath alcohol levels (averaged over all subjects) throughout the session. “Drink” shade corresponds to the timing and duration of alcohol/placebo ingestion, and “fMRI Scan” corresponds to the timing and duration when brain activation was measured. Note, the linear increase from the first time point (prior to ingestion of the beverage) to the second time point (after fMRI scanning) is an estimation.

