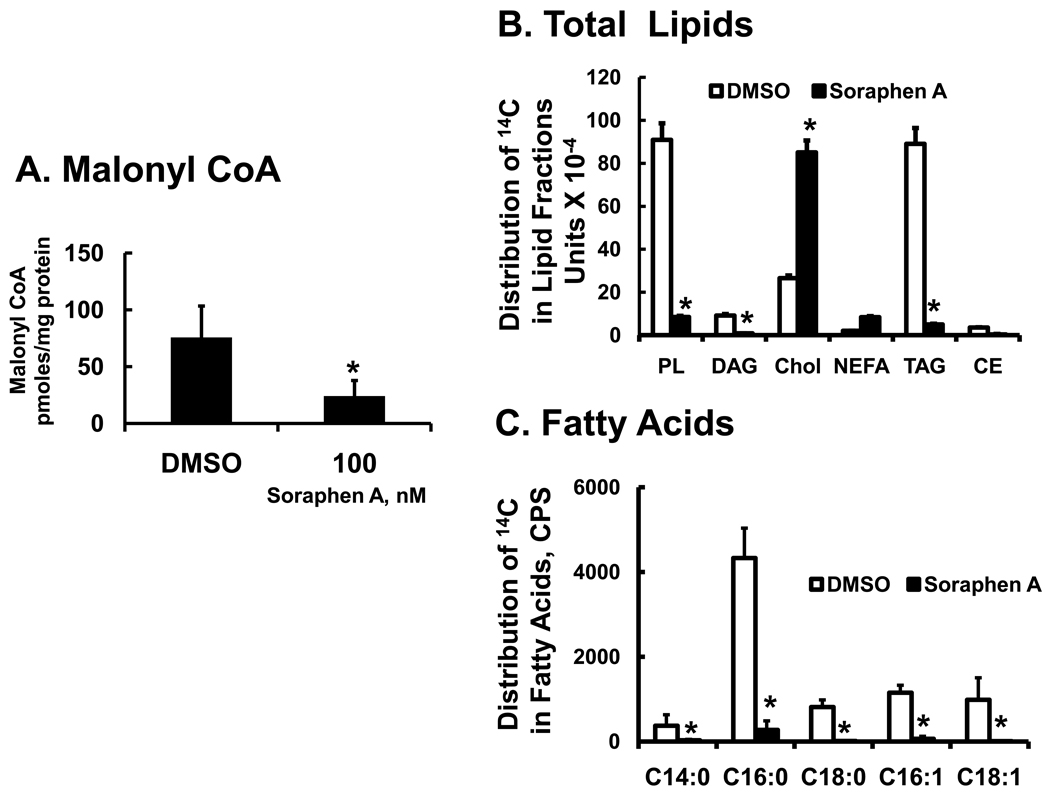
Figure 1. Effect of soraphen A on cellular malonyl CoA and [2-14C]-acetate metabolism in HepG2.
A: Measurement of malonyl CoA in HepG2 cells. HepG2 cells were grown to ~90% confluence in 100 mm Petri dishes in DMEM + 10% FBS. Cells were treated with DMSO (0.5%, vehicle for soraphen A] or soraphen A (100 nM) for 6 hrs, harvested and extracted for malonyl CoA (Methods). Results are expressed as Malonyl CoA, pmoles/mg protein; the results are the mean + standard deviation (S.D.); n = 5; *; p<0.01, t-test.
B & C: Effect of soraphen A on de novo lipogenesis in HepG2 cells. HepG2 cells grown in 6 well plates were treated with DMSO (white bars) or soraphen A (100 nM, black bars) for 2 hrs. prior to adding [2-14C]-acetate (0.5 µCi/well-6 well plate; 4.3 µM; 58 mCi/mmole). Cells were maintained in media containing DMSO or soraphen A for an additional 6 hrs and then extracted for total lipids (panel B) or fatty acids (panel C) (Methods). Total lipid was fractionated by thin layer chromatography & the distribution of 14C in lipid fractions was quantified by phosphor image analysis. Lipid standards (cholesterol ester [CE, 18:1,n-9], triacylglycerol [TAG, triolean], NEFA [18:1,n-9], cholesterol (Chol), diacylglycerol [DAG, diolean] and polar lipid [PL, phosphatidyl choline] were obtained from Nu-Chek Prep & Avanti Polar Lipids. Results are expressed as phosphor-image units × 10−4 mean ± SD, n=3; *, p≤0.05 DMSO (white bars) versus soraphen A (black bars). Total lipids were saponified and the resulting non-esterified fatty acids were fractionated and quantified by RP-HPLC and β-scintillation counting. Results are expressed as Distribution of 14C-in fatty acids, CPS (counts/second) mean ± SD, n=3; *, p≤0.05 DMSO (white bars) versus soraphen A (black bars).

