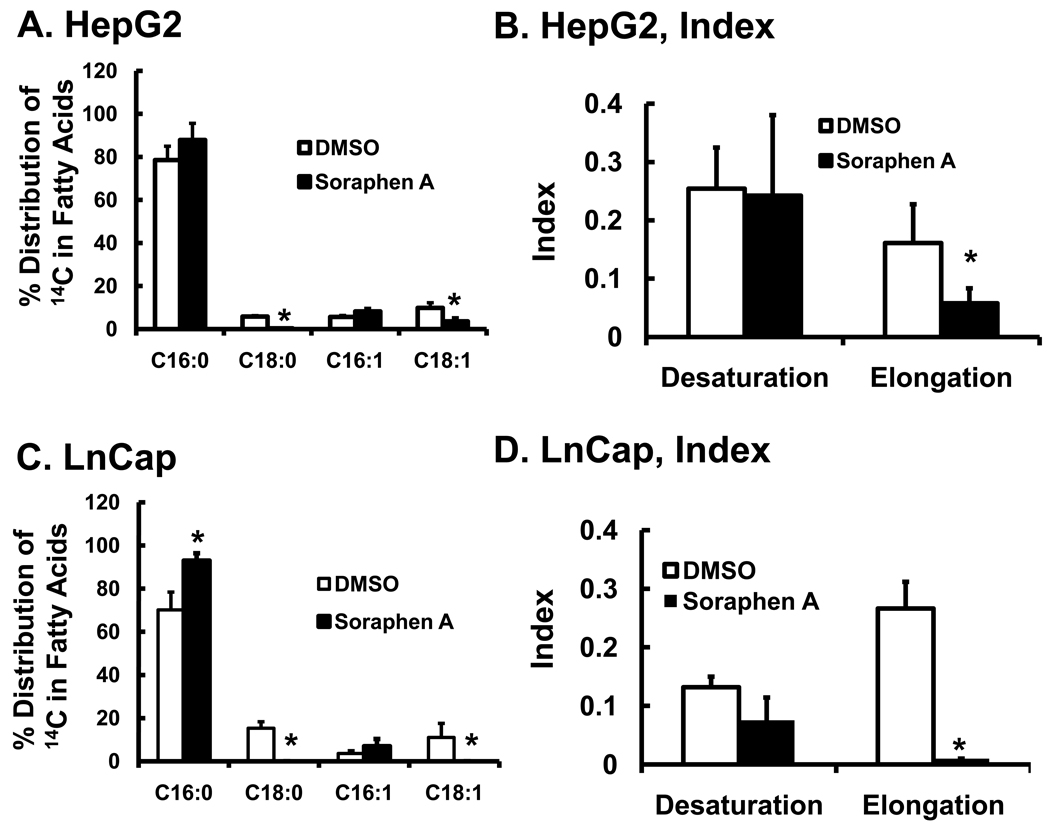
Figure 2. Effect of soraphen A on palmitate metabolism.
HepG2 and LnCap were grown to 80% confluence as described in the Methods and treated with DMSO or soraphen A (100 nM) for 2 hrs prior to addition of 14C-16:0 (50 µM). Cells were maintained in the presence of vehicle (DMSO) or soraphen A (100 nM) for an additional 6 hrs. After treatment, cells were extracted for total lipid, saponified and fractionated by RP-HPLC as described in Methods. Panels A & C illustrate the distribution of 14C in 16:0 and its elongation and desaturation products in HepG2 cells [A] and LnCap cells [C]. Results are reported as % Distribution of 14C in Fatty Acids, mean ± SD, n=4; *, p≤0.05 DMSO (white bars) versus soraphen A (black bars). Panels B and D represent the desaturation and elongation index calculated from the data in Panels A and C, respectively. The desaturation index was calculated by summing the 14C-CPS in [16:1,n-7 + 18:1,n-7 + 18:1,n-9] and dividing by the sum of 14C-CPS in [16:0 + 18:0]. The elongation index was calculated by summing the 14C-CPS in [18:0 + 18:1,n-7 + 18:1,n-9] and dividing by the sum of 14C-CPS in [16:0 + 16:1,n-7].

