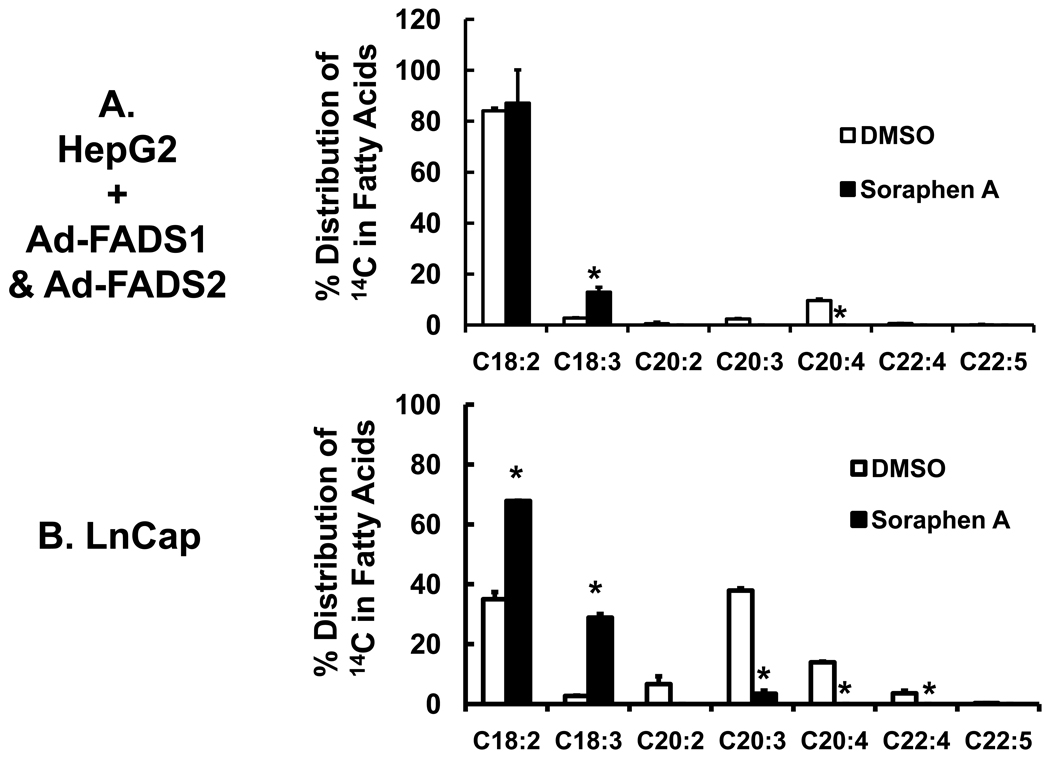
Figure 6. Effect of soraphen A on 18:2,n-6 metabolism in cells with elevated PUFA metabolism.
Panel A: Infection of HepG2 with recombinant adenovirus expressing FADS1 (Ad-FADS1) and FADS2 (Ad-FADS2). HepG2 cells were infected with Ad-FADS1 and Ad-FADS2 at 20 PFU/cell each. The effect of Ad-FADS1, Ad-FADS2 and the combination of Ad-FADS1 & Ad-FADS2 on 18:2,n-6 metabolism in HepG2 cells is illustrated in Fig. 4S, Supplementary data. Forty-eight hours after adenoviral infection, HepG2 cells were treated with DMSO (white bars), soraphen A (black bars) and [1-14C]-18:2,n-6 (50 µM) as described in Fig. 5. Six hours later, cells were harvested for lipid extraction, saponification and fractionation. Results are expressed as % Distribution of 14C Fatty Acids; mean ± SD, n=3; *, p≤0.05 DMSO versus soraphen A. Panel B: Effect of soraphen A on 18:2,n-6 metabolism in LnCap cells. LnCap cells were treated with DMSO (white bars) or soraphen A (black bars) for 2 hrs prior to the addition of 14C-18:2,n-6 (50 µM). Six hours afterward, cells were harvested for extraction, saponification and RP-HPLC fractionation. Results are expressed as % Distribution of 14C Fatty Acids; mean ± SD, n=3, *, p≤0.05 DMSO versus soraphen A, t-test.

