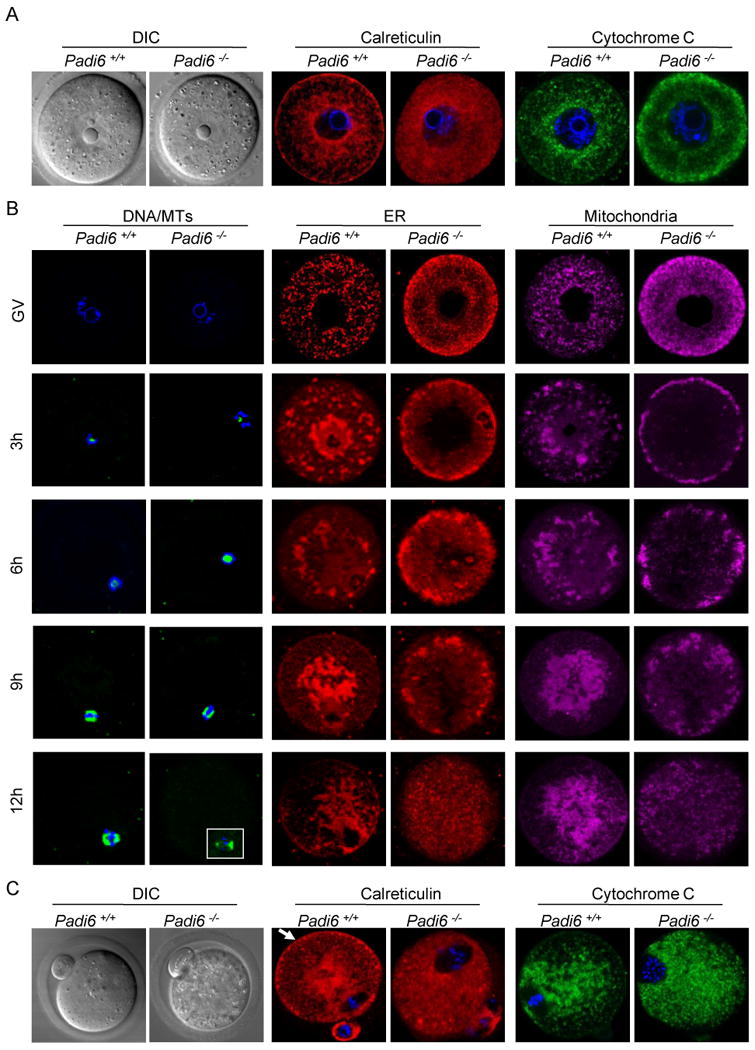
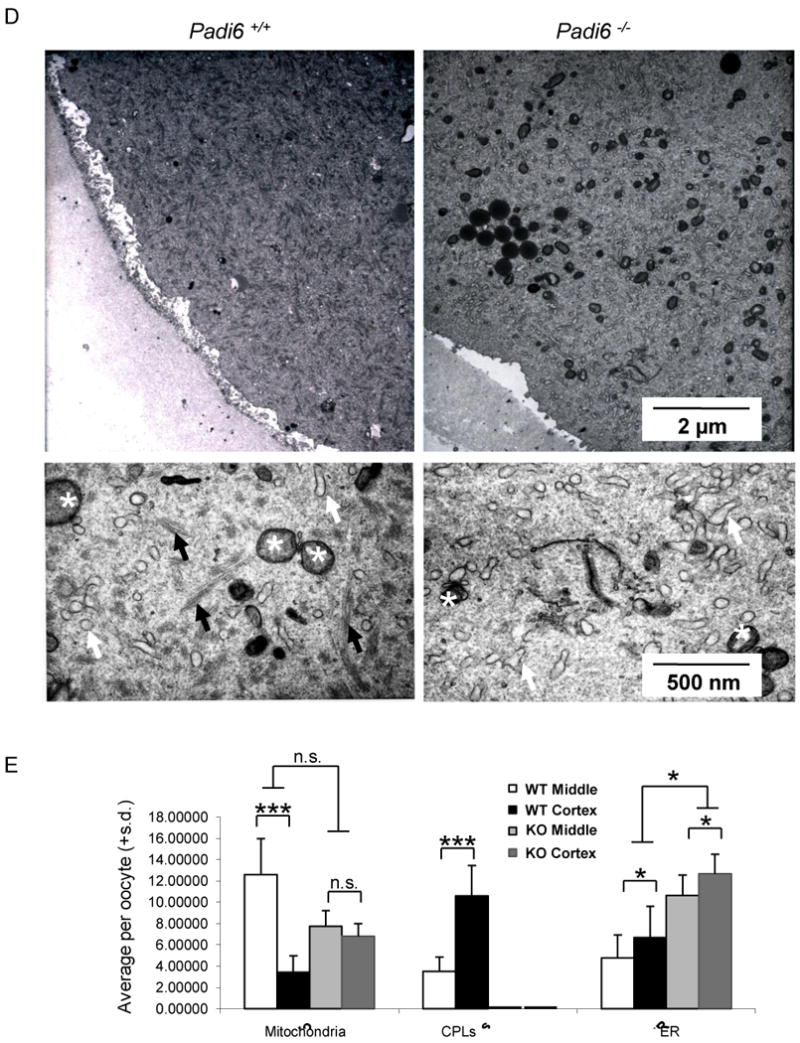
Figure 3. Endoplasmic reticulum (ER) and mitochondrial positioning and redistribution during maturation is altered in Padi6-null oocytes.


(A) ER and mitochondria localization in GV-stage PFA-fixed oocytes following staining with antibodies to calreticulin (red) and Cytochrome C (green). DIC, differential interference contrast. (B) Time course of organelle redistribution during oocyte maturation. DNA was stained using Hoechst 33342 (blue) and MT was stained with Oregon green 488 Taxol. ER and mitochondria were stained with ER tracker and Mito Tracker, respectively. Oocytes were collected at 3-hour intervals during in vitro culture, fixed, prepared for IIF and imaged by confocal microscopy. (C) Organelle localization in ovulated oocytes recovered from oviducts at 13 hours post hCG and prepared as in (A). Arrow indicates cortical ER aggregates. (D) TEM images of the metaphase II-arrested wild-type and Padi6-null oocyte cortex. The lower panels in (D) are high magnification images. ER and mitochondria are indicated by white arrows and asterisks, respectively. CPLs are indicated by black arrows. (E) Morphometric analyses of CPLs and organelles in the cortical and middle region of wild-type and Padi6-null oocytes. *, P < 0.05; ***, P < 0.0001; n.s., not significant. Numbers are mean ± S.D. of percentage per oocyte. See also Movie S1 and S2.
