Figure 2.
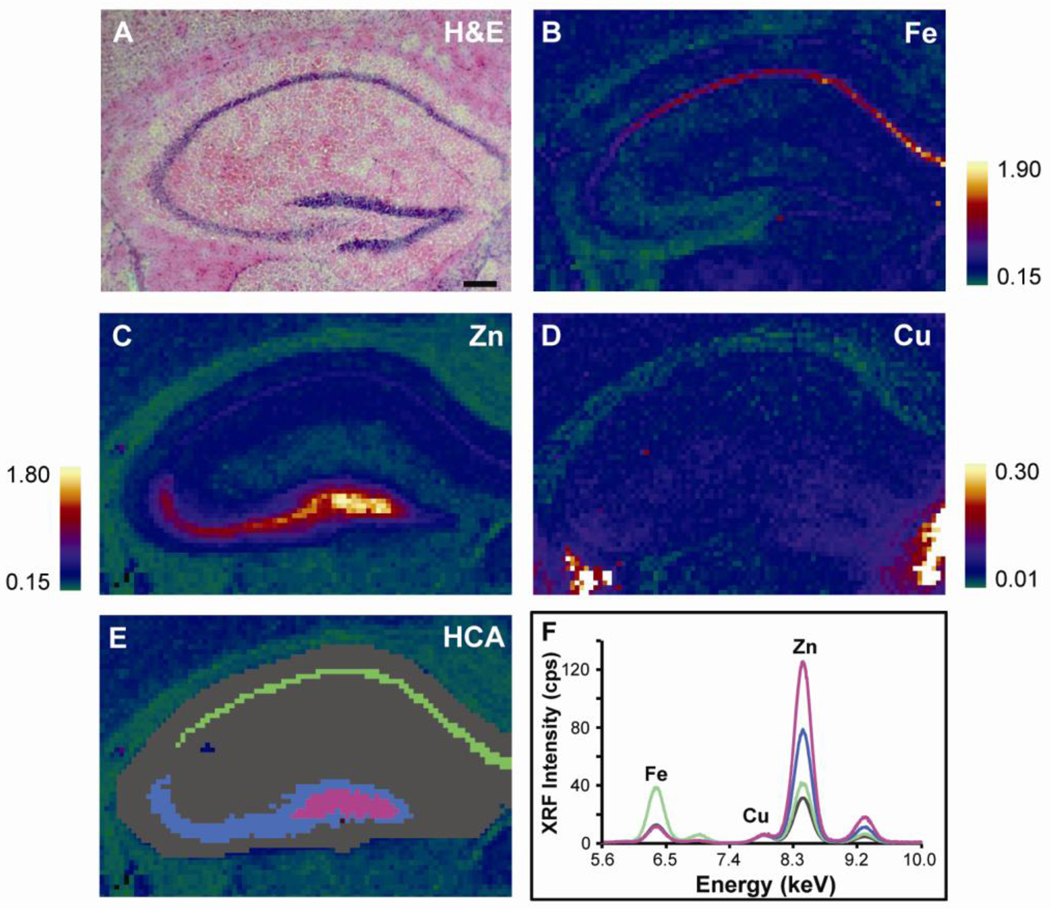
Spatial distribution of Fe, Cu, and Zn in the hippocampus of PSAPP and CNT mice measured using XFM. (A) H & E stained hippocampal brain section from a PSAPP mouse. XFM images of (B) Fe, (C) Zn and (D) Cu in a serial tissue section. Units are mM. Scale bar = 300 µm. (E) Hierarchical cluster analysis (HCA) was used to create unsupervised regions of interest (ROIs) based on Fe, Cu, and Zn content in order to compare metal content in separate regions of the hippocampus. On average, four clusters were required to separate the images into histological ROIs where the dendritic layer is gray, the PCL is green, CA3 is blue, and the hilus is magenta. These areas corresponded to distinct anatomical regions of the hippocampus defining four distinct regions of the hippocampus. (F) Average XFM spectra from each ROI.

