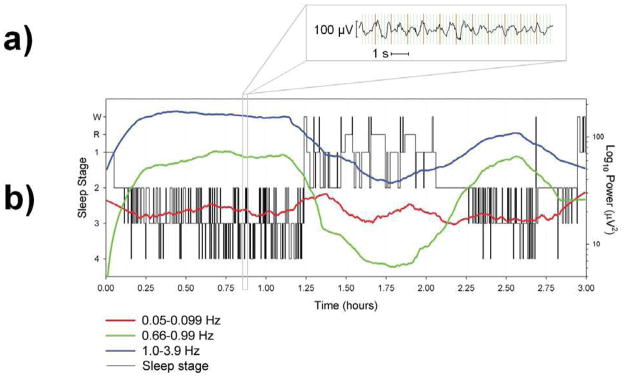
Fig. 1.
EEG results from one participant who slept for the maximum duration of three hours during a single scan. a) Example of a 12-second epoch of EEG during sleep stage 4 after fMRI gradient and ballistocardiographic artifact removal. b) Sleep scoring (left axis) and spectral power (right axis) for the three oscillations under investigation. Spectral power data are smoothed using a negative exponential (1st degree) smoother with rejection of outliers. Smoothed spectral power was used to create this figure because overlap in the fluctuations obscured the overall trend of the individual bands. Raw (i.e., unsmoothed) EEG spectral power was used in the correlations with fMRI activity. W = Wakefulness and R = REM.

