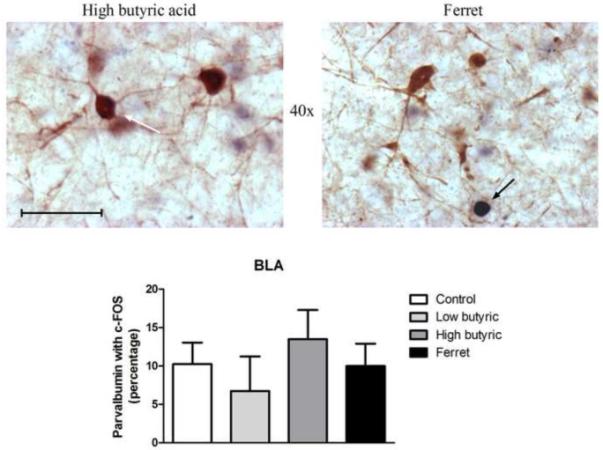
Figure 4.

(Top) Representative photomicrograph with parvalbumin (brown) and c-Fos (blue/black) labeling in high butyric acid (left) and ferret odor-exposed (right) rats. Parvalbumin-staining was isolated to the BLA. (Bottom) No changes in c-Fos expression in parvalbumin neurons following differential odor exposure (N=4-7). Scale bar represents approximately 50 microns. The white arrow points to a single-labeled parvalbumin neuron, and the black arrow points to a single-labeled c-Fos neuron.
