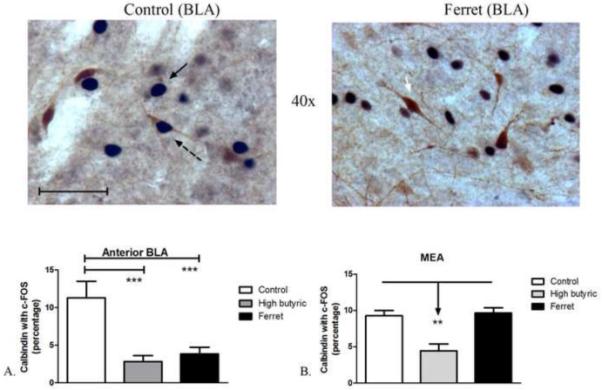
Figure 5.

Odor exposure-induced changes in c-Fos expression in calbindin neurons. (Top) Representative photomicrograph with calbindin (brown) and c-Fos (blue/black) labeling in control (left) and ferret odor-exposed (right) rats. (Bottom, A) Exposure to high amounts of butyric acid (50-100 μL) and ferret odor decreased the percentage of calbindin-positive neurons with c-Fos in the anterior portion of the BLA compared to control odor-exposure. (Bottom, B) Exposure to high amounts of butyric acid decreased the percentage of calbindin-positive neurons with c-Fos in the MEA compared to control odor- and ferret odor-exposed rats. ***P<0.001, **P<0.01 (N=4-11). Scale bar represents approximately 50 microns. The white arrow points to a single-labeled calbindin neuron, the black arrow points to a single-labeled c-Fos neuron, and the dashed black arrow points to a double-labeled calbindin/c-Fos neuron.
