
Figure 1.
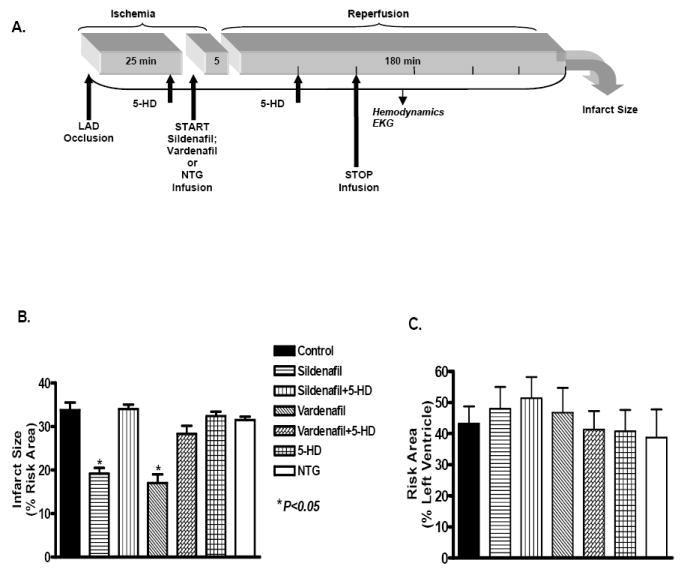
A. Experimantal protocol for ischemia and reperfusion. Arrows indicate the exact points of pharmacological drug administration for the various groups. B. Infarct size expressed as percent of the area at risk in the various experimental groups. C. The risk area expressed as percent of the left ventricle in the various groups. * denotes significant difference versus all other groups.