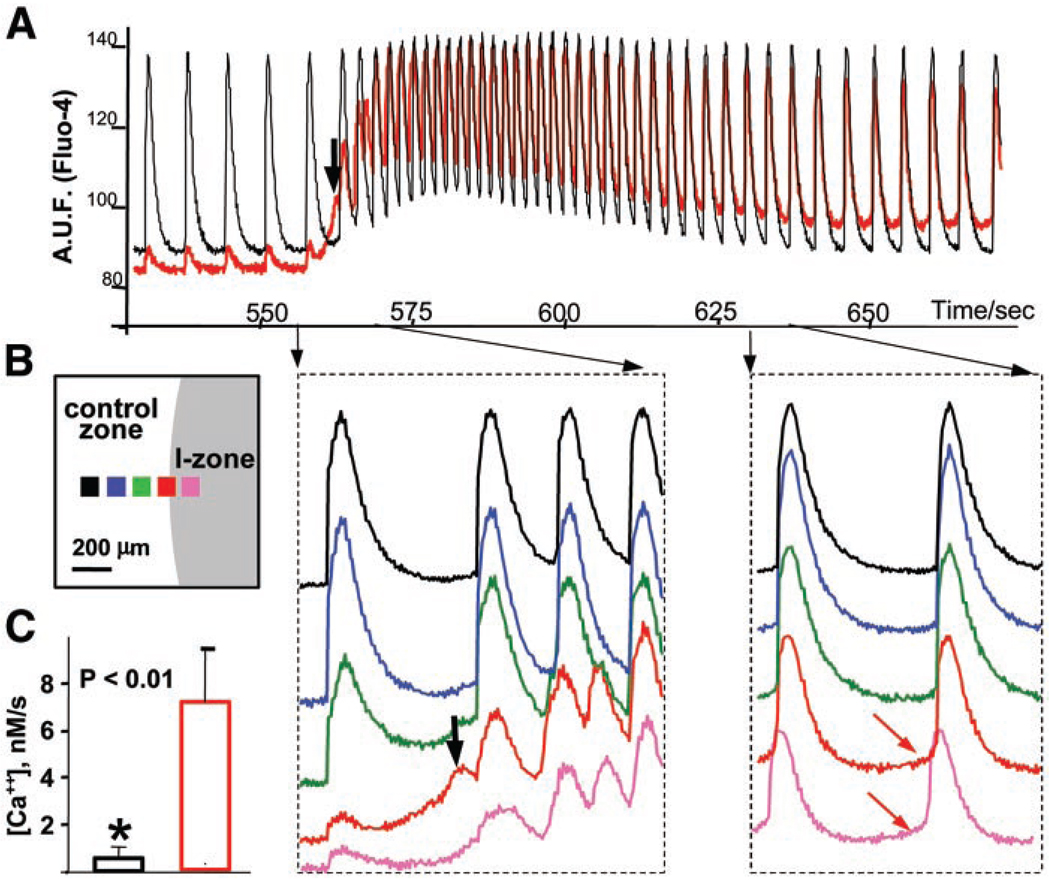
Fig. 3.
Changes in diastolic associated with ectopic activity. A: two traces from control (black) and border (red) zones illustrating an entire tachyarrhythmic episode are shown. Reperfusion was initiated at 550 s. The black arrow points to the first ectopic beat. B: relative position of the five regions of interest that used to acquire the traces on the right. The traces (shown in corresponding colors) reveal individual CaTs during the initial and late stages of the tachyarrythmic episode. The arrows point to the respective timing of the selected intervals. The red arrows point to a positive slope in diastolic observed in ectopic regions. C: the averaged diastolic slope of CaTs from the ectopic regions (red column) was significantly greater (P = 0.003) than that from the control zone (black column). Fluo 4 fluorescence was converted to , as described in materials and methods, to calculate these slopes.

