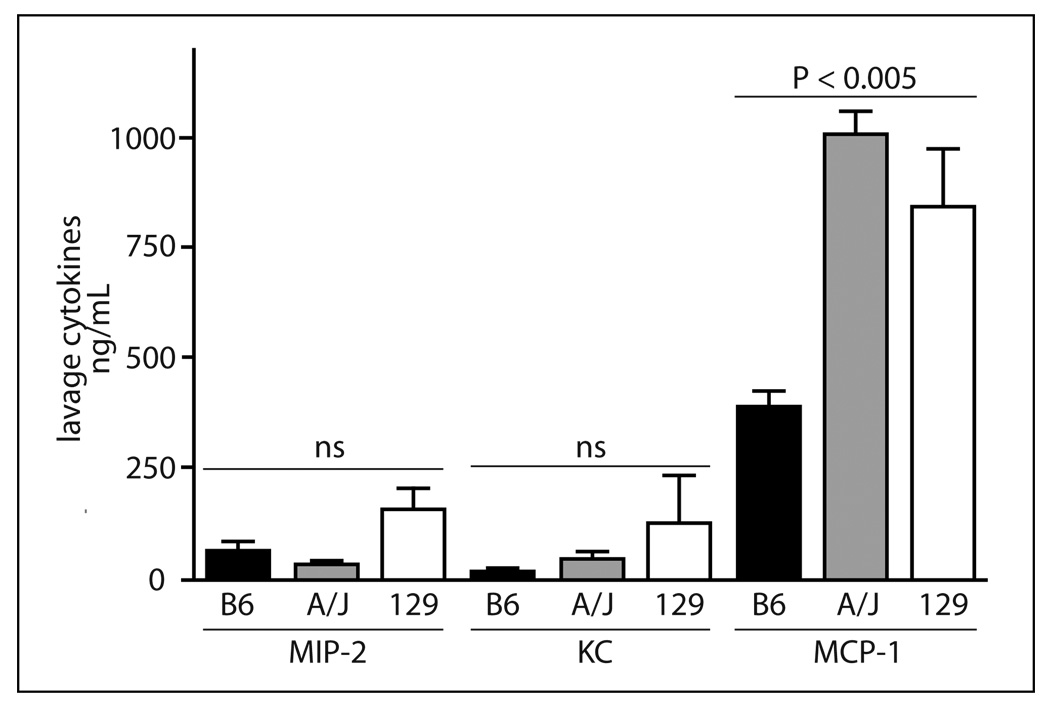
Fig. 6.
Cytokines determined in lavage 20 h after insertion of the disks in the bioimplant model. Values expressed as pg/mL are the mean ± SEM of 3–4 mice per strain. Results of a one-way ANOVA are indicated for each cytokine. A Newman-Keuls post-test for the MCP-1 values indicated both A/J and 129 values were significantly (P <0.01) different than B6 values.

