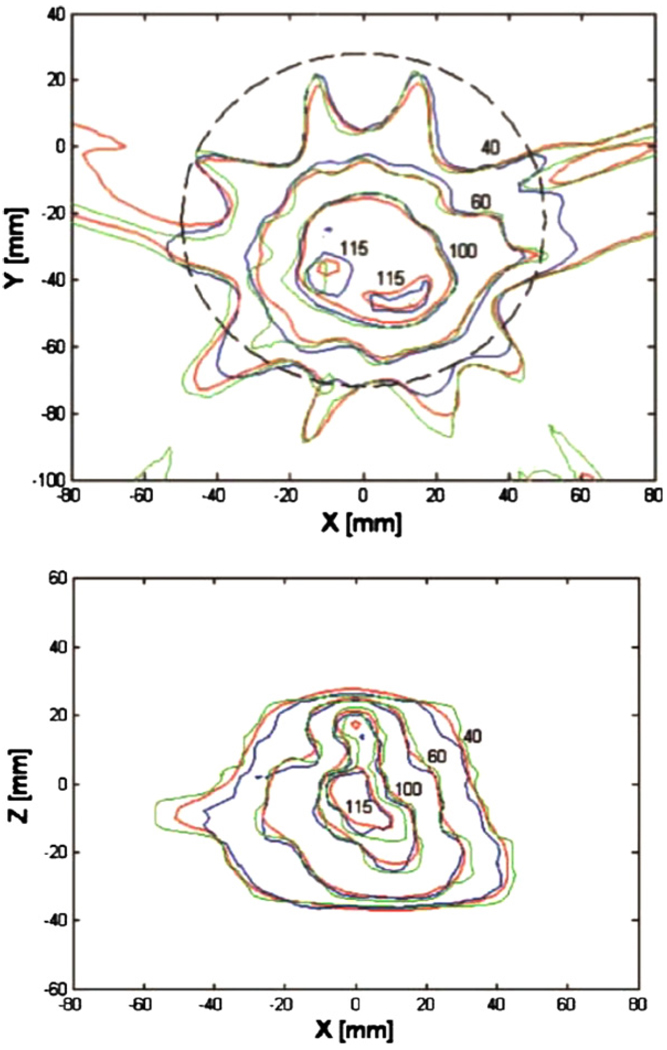
Figure 12.
Examples of optical CT imaging using a laser system: (a) comparison of dose distributions in the central axial plane, with isodose lines at 40%, 60%, 100% and 115%, from treatment planning calculations (red), gel measurement (blue) and EDR2 measurements (green) (Wuu and Xu 2006); (b) same phantom as (a), results from sagittal plane 2 cm left of central plane. Reproduced with permission.

