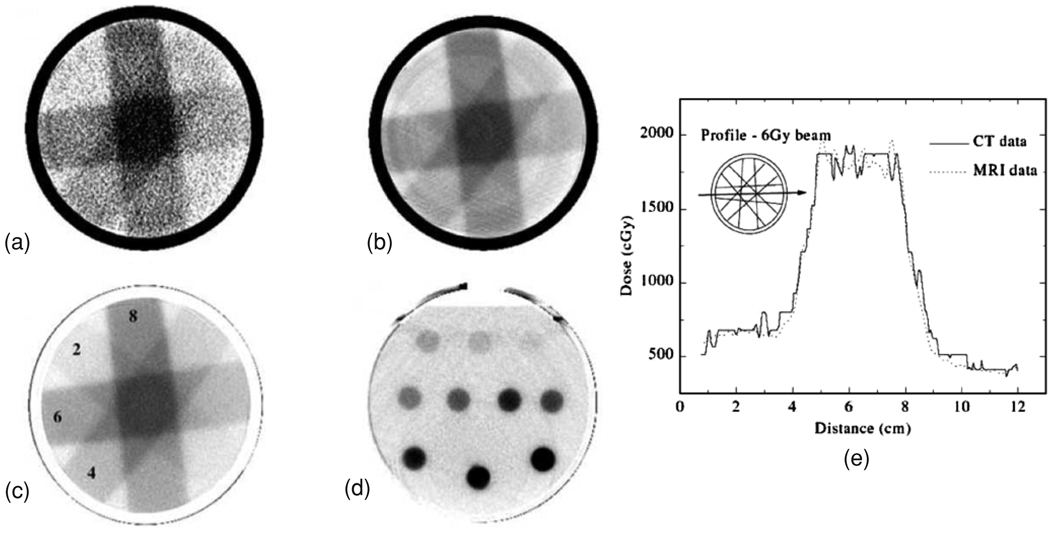
Figure 14.
(a) X-ray CT images of PAG irradiated with four 3 × 3 cm2 10 MV photon beams (doses in Gy at the depth of maximum dose) (a)–(c) and parallel opposed, 2 cm diameter, circular 6 MV photon beams (d). A preliminary CT image is shown in (a) and a noise reduced (by averaging) CT image in (b). Note the ring and beam hardening artifacts in (b). Images in (c) and (d) are the optimized images resulting from image averaging and background subtraction with the images acquired from an unirradiated blank gel. The dose profile along the axis of the 6 Gy beam path corresponding to the dose image of (c) is shown in (e) in comparison with a profile obtained in an MR acquired dose image (Hilts et al 2000). Reproduced with permission.

