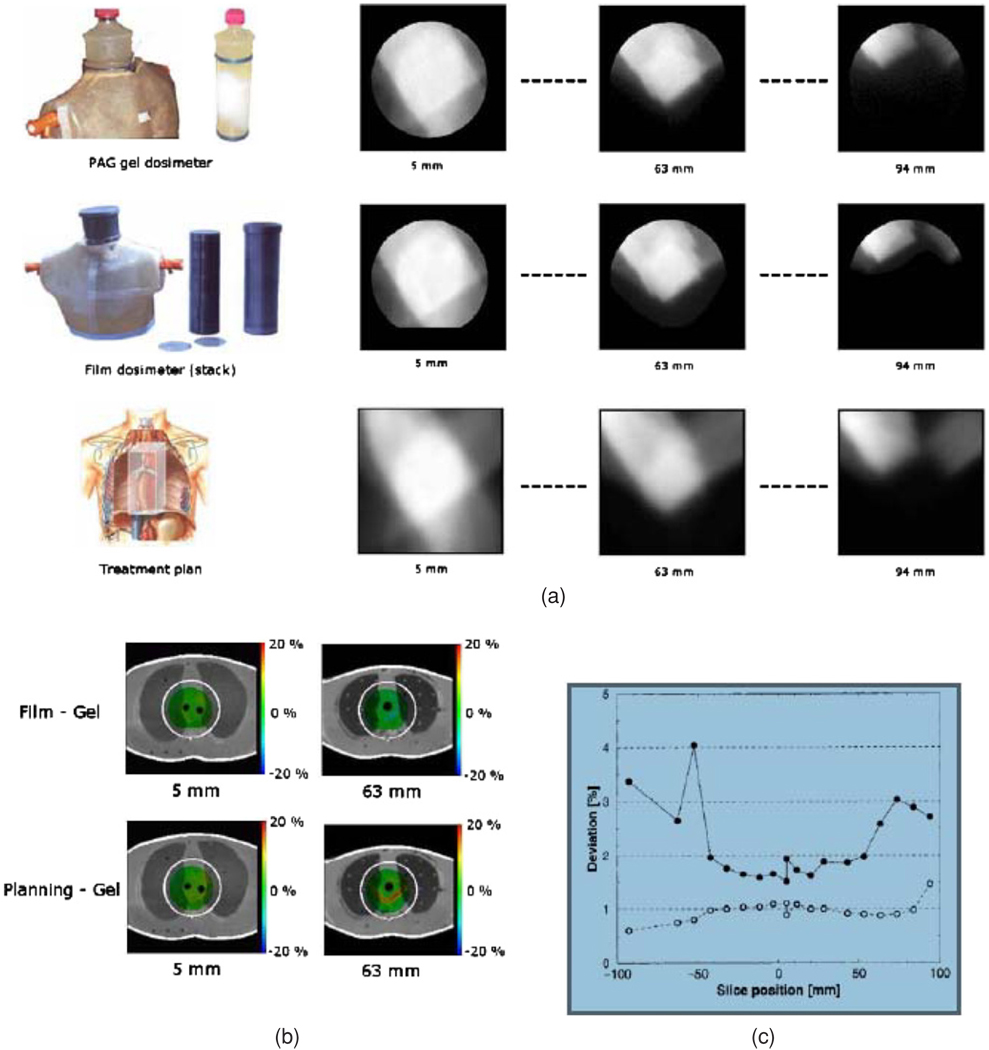
Figure 23.
(a) Stack of corresponding dose maps obtained by three different dosimetry techniques: gel dosimetry, film dosimetry and computer planning. (b) Color-washed difference images superimposed onto anatomical CT-images. (c) Mean structural root-mean-square difference (closed symbols) and stochastic root-mean-square difference (open symbols) in corresponding dose maps obtained with gel dosimetry and film dosimetry (De Deene et al 2000c). Reproduced with permission.

