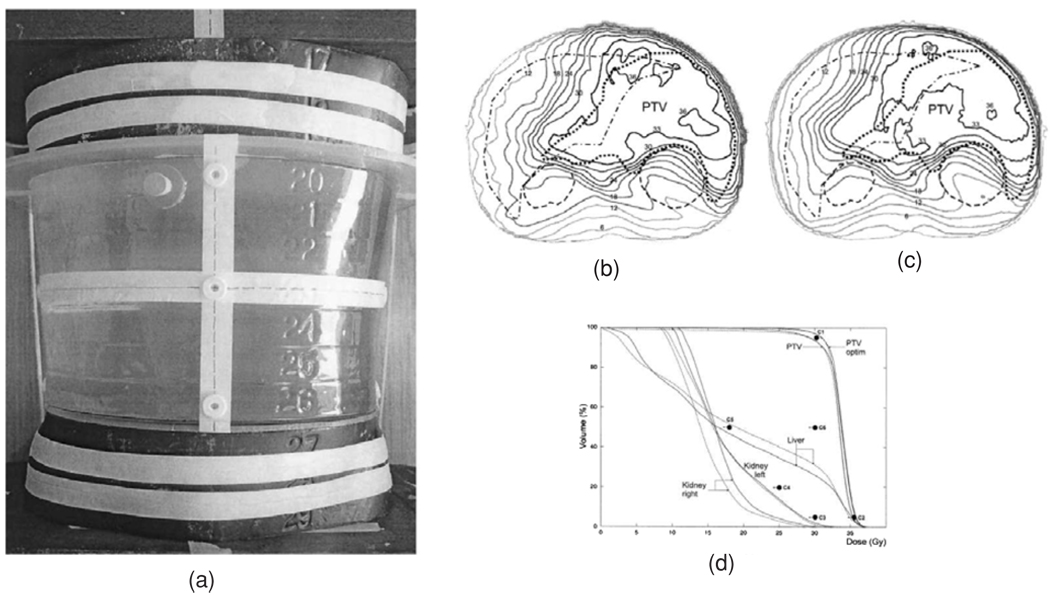
Figure 24.
Dose verification of an IMAT treatment using polymer gel dosimetry. (a) A 10 l Barex cast was filled with PAG. At each side of the phantom, three slices of the anthropomorphic Rando phantom were added in the cranio-caudal direction to obtain full scatter conditions. Dose distributions in the middle transverse plane of the phantom as calculated with a collapsed cone convolution/superposition algorithm (b) and measured with polymer gel dosimetry (c). Corresponding dose–volume histograms for PTV, liver and kidneys are also shown (d) (Duthoy et al 2003). Reproduced with permission.

