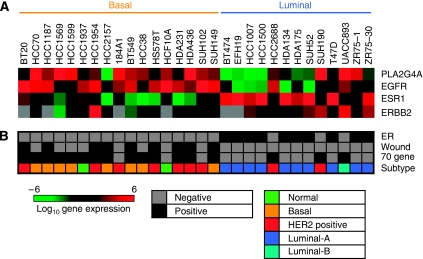
Figure 2.
Correlation between cPLA2α mRNA expression and clinicopathological characteristics in a panel of 30 breast cancer cell lines. (A) Log2 expression levels of cPLA2α (PLA2G4A), ERα (ESR1), EGFR and HER2 (ERBB2) are depicted by the indicated pseudo-colour scale (grey represents missing or poorly measured data). (B) Classification of cell lines by ER status, by positivity for 70 gene and wound response signatures, and by nearest resemblance to tumour gene expression subtype (normal, luminal A, luminal B, HER2 positive, basal-like).

