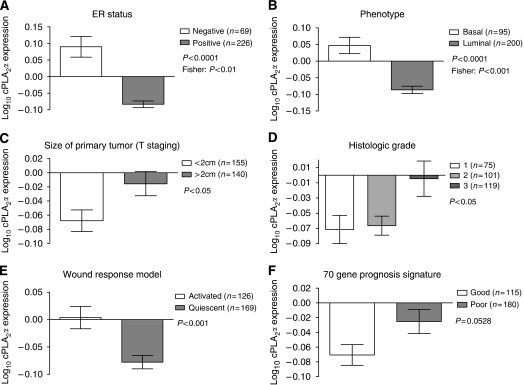
Figure 3.
Correlation between cPLA2α mRNA expression and clinicopathological characteristics in 295 breast cancer patients. Log10 expression of cPLA2α compared with (A) ER status, (B) basal-luminal phenotype, (C) size of primary tumour, (D) histology grade, (E) the wound response signature and (F) the 70 gene signature. The number of patients (n) in each group is indicated. P-values were calculated with Student's t-test, or with Fisher's exact test (where indicated).

