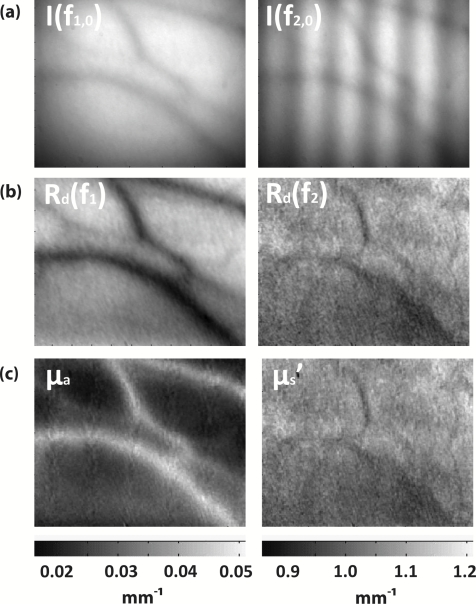
Figure 1.
SFDI data flow. (a) Multiple frequencies (fx) are projected onto the sample, and remitted intensity I is captured. (b) Each illumination frequency is imaged at three phases, then demodulated and calibrated to yield Rd. (c) The Rd at each pixel is fit for μa and μ’s using a Monte Carlo light-transport model and lookup table to yield optical property maps.

