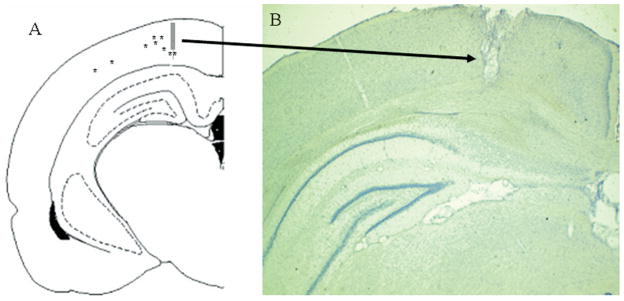
Fig. 2.
Illustration and example of the final recording sites for moveable stereotrodes into the PPC. (A) A schematic illustration of the final placement of the moveable electrodes, which extended 1.0 mm beyond the guide cannula and were located at AP −4.5, within ML ±2.5–4.0, and DV 1.0. (B) An example showing the final placement of electrode and cannula. The electrolytic lesion and tract produced by the electrode cannula are readily visible (arrow).

