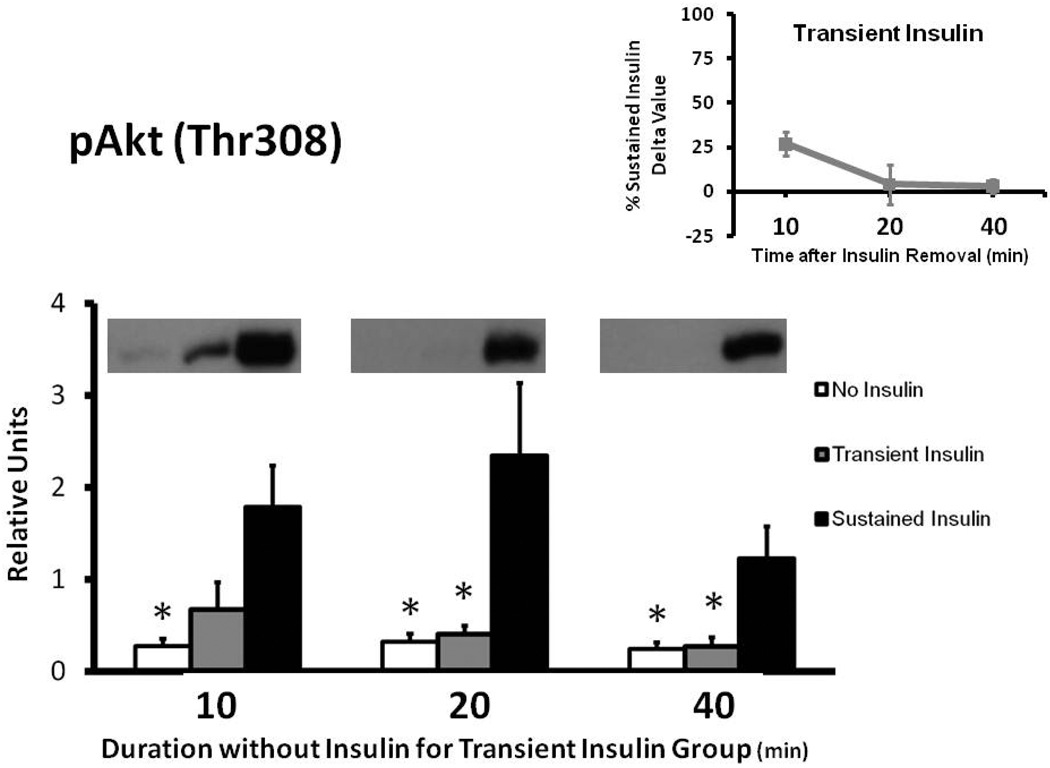
Figure 1.
Phosphorylation of AktThr308 (pAkt) in rat epitrochlearis samples determined by immunoblotting. *p < 0.05 versus Sustained Insulin group. Data are means ± SEM. n=6–8 muscles per treatment at each time. The values on the x-axis refer to the duration (min) after muscles in the Transient Insulin group were removed from insulin prior to being freeze-clamped. Inset: Delta pAkt for the Transient Insulin Group expressed as a percentage of the Sustained Insulin Group for each time point examined. Delta pAkt values were determined by subtracting the mean value for the No Insulin group from the values for each muscle in the insulin-stimulated groups (Transient Insulin or Sustained Insulin) at each time.

