
Figure 4.
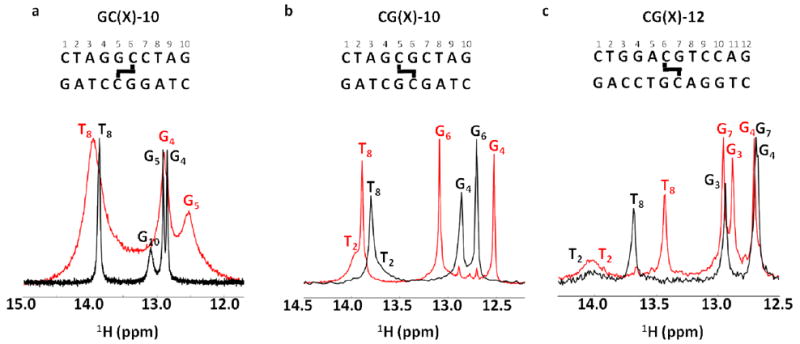
Imino spectra of the six normal and crosslinked DNA duplexes in Figure 2 (GC-10 and CG-10 at 10 °C and CG-12 at 15 °C, pH 7.0 no ammonia exchange catalyst). The imino spectra of the normal duplexes are shown in black, and their cognate crosslinked forms are shown in red. For reference, the DNA sequences and position of the crosslink are shown above each spectrum.