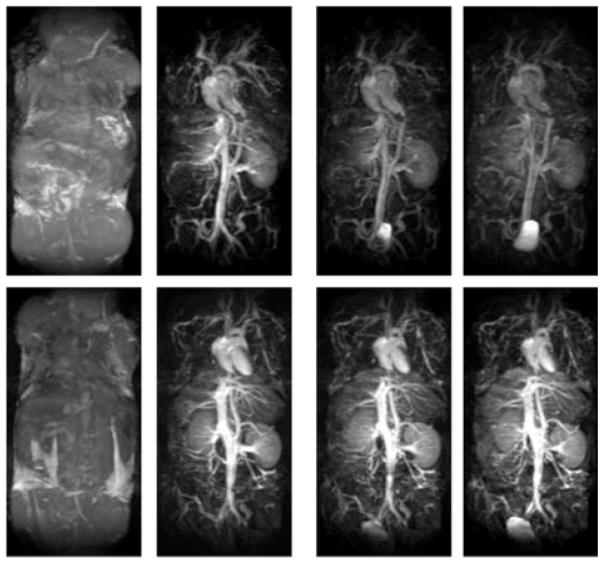
Figure 1.
Coronal maximum intensity projection (MIP) of the 3D FLASH images obtained from the mice injected with HA–(EDA–DTPA–Gd) at 0.1 mmol Gd kg−1. Pre-contrast and 0, 10 and 30 min post contrast images are shown from left to right. Post-contrast images are shown here after the subtraction of the corresponding pre-contrast images. Top images are from 16 kDa HA and lower images are from 74 kDa HA.

