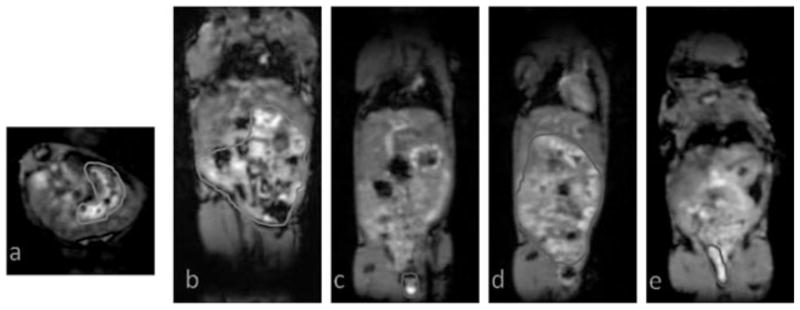
Figure 4.

3D FLASH images obtained from a mouse injected with 16 kDa HA–(EDA–DTPA–Gd), areas with gadolinium uptakes are highlighted. (a, b) Axial and coronal images showing the stomach and lower gastrointestinal uptake at 1 h post injection. (c, d) Coronal images showing the lower gastrointestinal and feces uptake at 7 h post injection. (e) A coronal image showing the presence of gadolinium enhancement in the feces at 24 h.
