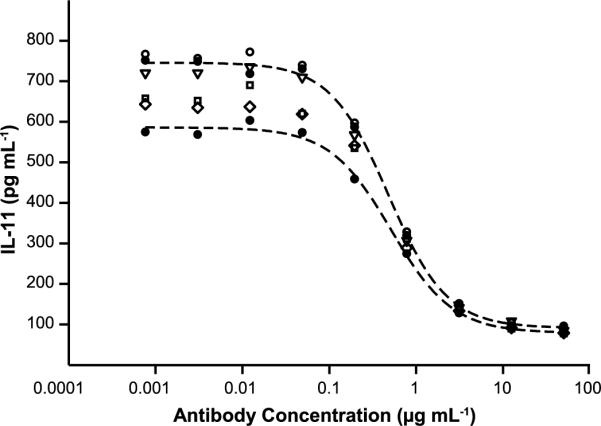
Figure 7.

Representative IL-11 inhibition dose response curves comparing functional behavior of nonencapsulated antibody to antibody released from varying concentration silk lyogels. Filled circles and dashed line four parameter fits represent the lowest and highest nonencapsulated control antibody responses from n=4 trials. Empty symbols represent one response curve from n=2 trials for 3.2% (circle), 6.2% (triangle), 9.2% (square) and 12.4% (diamond) lyogels.
