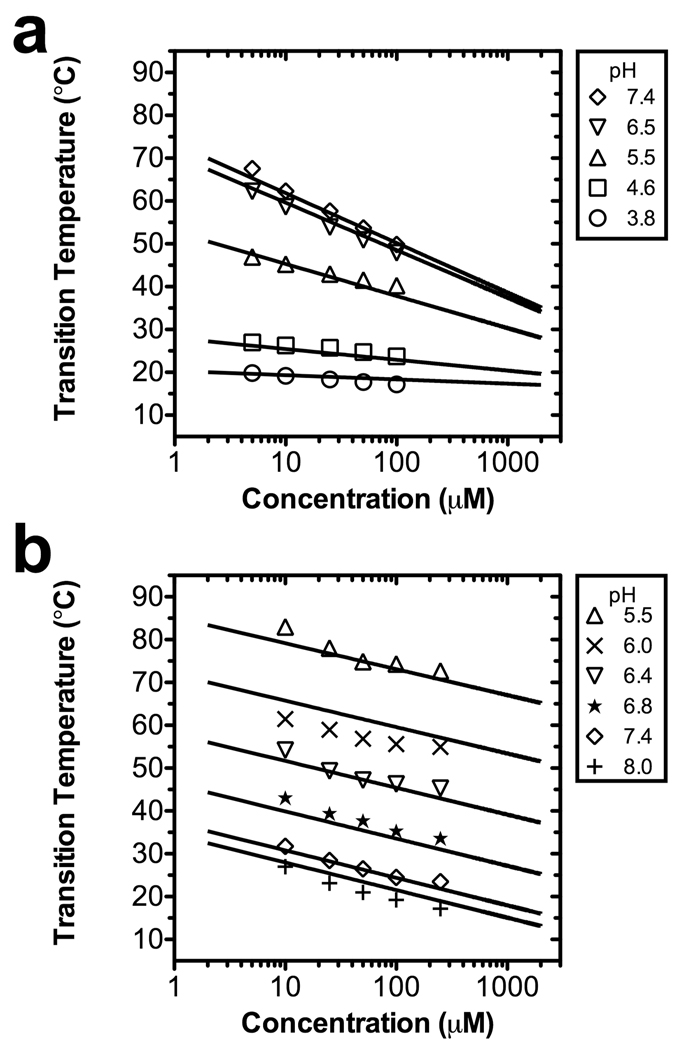
Figure 1.
The pH and concentration dependence of ELP phase behavior. ELP transition temperatures are plotted as a function of the logarithm of the polymer concentration. For each pH, a best-fit line to Eq. 7 is presented (Table 1). (a) An acidic ELP of 160 pentamers containing guest residues V:I:E [1:3:1] with a pKa of 5.29. (b) A basic ELP of 120 pentamers containing guest residues V:H:G:A [1:2:1:1] with a pKa of 6.22.

