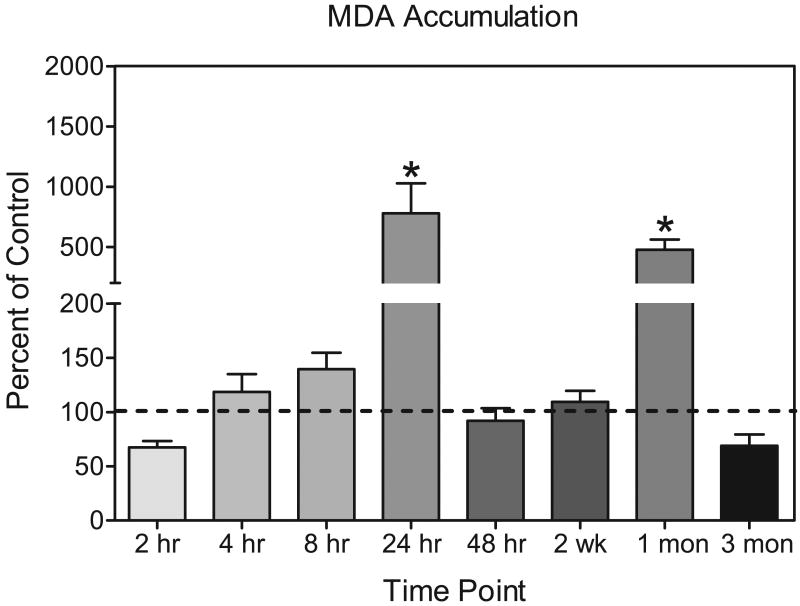
Fig 4.
MDA accumulation in male F344 rats presented as percent of control (± SEM). Rats were treated with 3-NP (16.5 mg/kg, i.p.) or saline and tested 2 hr, 4 hr, 24 hr, 48 hr, 2, week, 1 month, or 3 months post injection. The same saline-treated control group (2 month old) was used for rats tested at 2 hr, 4 hr, 24 hr, and 48 hr (x̄ =0.0867 nm/mg protein ± 0.033). Rats at the later time points were compared to age-matched saline controls (2.5 month : x̄ = 0.116 nm/mg protein ± 0.011; 3 month: x̄ = 0.162 nm/mg protein ± 0.047; 5 month; x̄ = 0.116 nm/mg protein ± 0.016). *Significantly different from saline controls represented by dashed line.

