Fig 8.

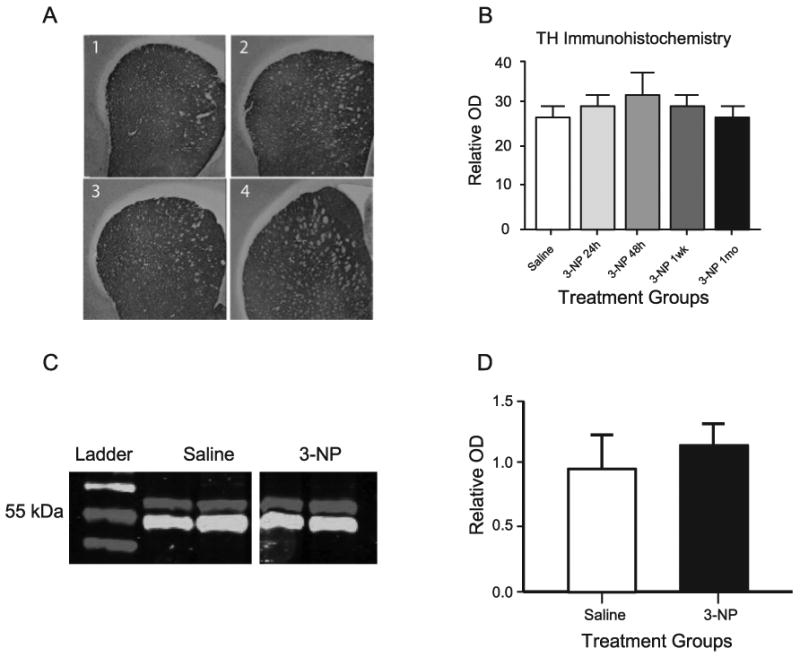
Analysis of striatal TH protein expression. (A) Representative coronal sections at mid-striatum of immunohistochemical staining for TH protein, Panel 1, saline injected; Panel 2, 24 Hr post-3-NP injection; Panel 3, 1 week post-3-NP injection; Panel 4, 1 month post-3-NP injection. (B) Tissue sections were analyzed for relative OD in the mid-striatum as an indicator of TH immunoreactive fiber density in coronal sections from rats injected with saline or 3-NP at 24 hours, 48 hours, 1 week, or 1 month. (C) Representative data from western immunoblotting showing bands for TH (upper band at 62 kDa) and α-tubulin (lower band at 50 kDa) for proteins extracted from age-matched saline treated rats (left 2 lanes) and 1 month post 3-NP treatment (right 2 lanes). (D) Quantification of relative TH expression determined by western immunoblot data derived from 5 rats from each group showing no difference between saline and 3-NP (1 month) groups.
