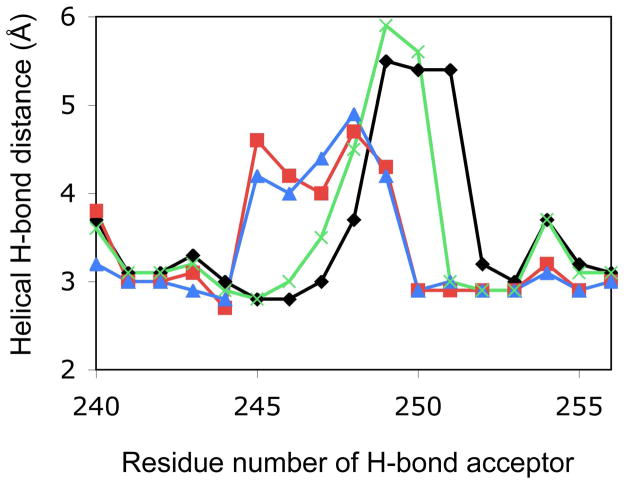
Figure 5.
Geometrical analysis of the I helix bulge. Distance between the hydrogen bond acceptor (i residue) and donor (i + 4 residue) in the I helix is plotted for P450cam-C (black, PDB entry 2CPP), P450cam-I (red, PDB entry 1RE9), P450cam-O (blue, PDB entry 3L62) and oxyferrous P450cam (green, PDB entry 1DZ8).

