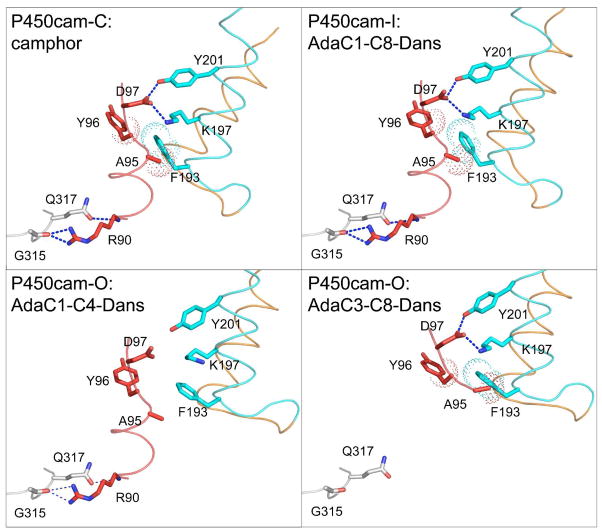
Figure 6.
Interactions between the B′ and G helices shown for P450cam bound to camphor (P450cam-C), AdaC1-C8-Dans (P450cam-I), AdaC1-C4-Dans (P450cam-O), and AdaC3-C8-Dans (P450cam-O). B′, F and G helices are colored in red, orange and cyan, respectively. Residues from the β3 strand is colored in white. Electrostatic interactions are shown in blue dash, while hydrophobic contacts are shown in as dotted spheres.

