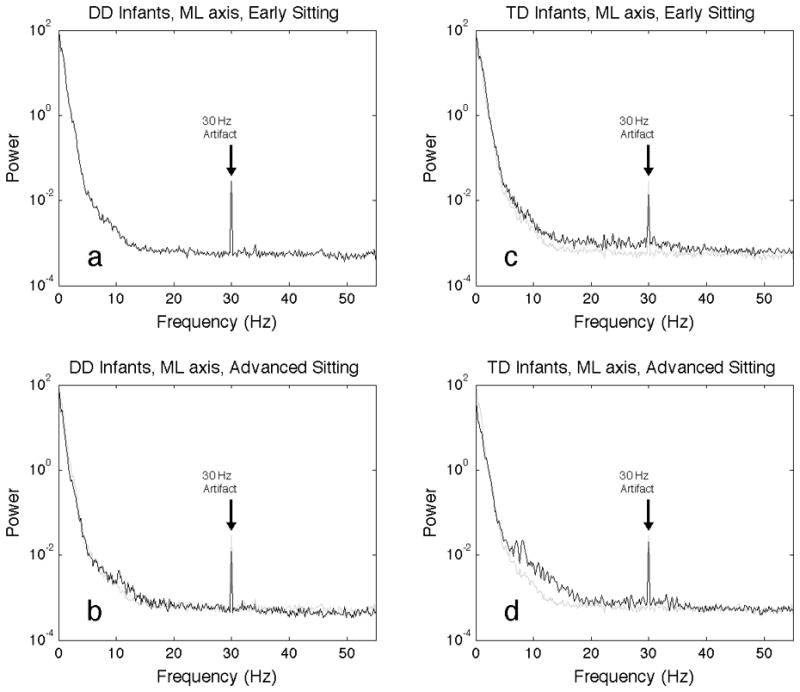
Figure 6.

Spectral analysis of infant sitting postural sway in the medial-lateral axis. Plotted in black is the average periodogram for all trials for infants with developmental delay, early sitting (a), advanced sitting (b), and infants with typical development, early sitting (c) and advanced sitting (d). To aid in visual comparison, plotted in grey on all four plots is the average periodogram for all trials of the developmentally delayed, early sitting. Artifacts seen at 30 Hz are due to electrical power distribution, and are not related to infant sitting.
