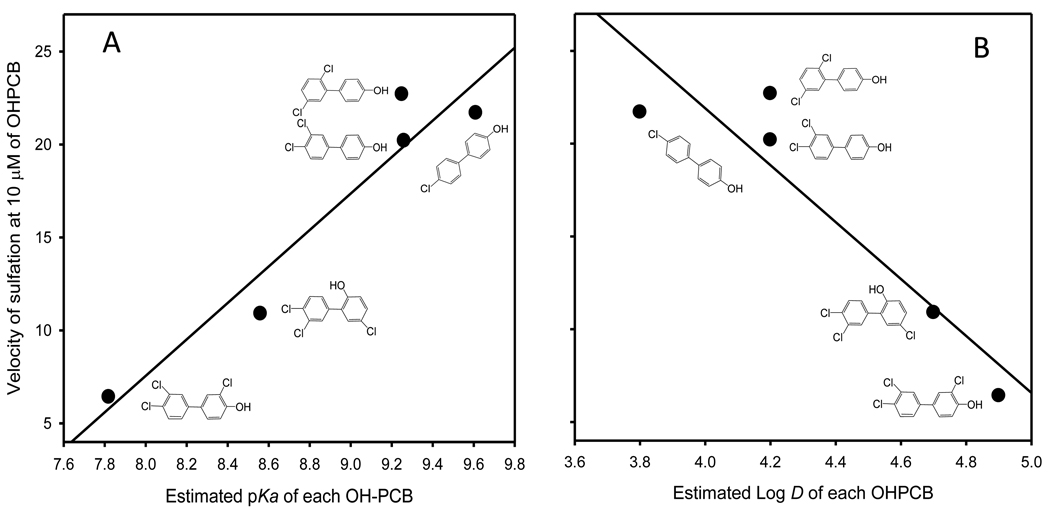
Figure 1.
Relationships between the rate of sulfation of OHPCBs catalyzed by rSULT1A1 and the estimated values for pKa and log D. The velocity of the sulfation reaction under fully reduced conditions at a OHPCB concentration of 10 µM is correlated with pKa (A) and log D (B). Values for r2 were 0.92 and 0.86, respectively.

