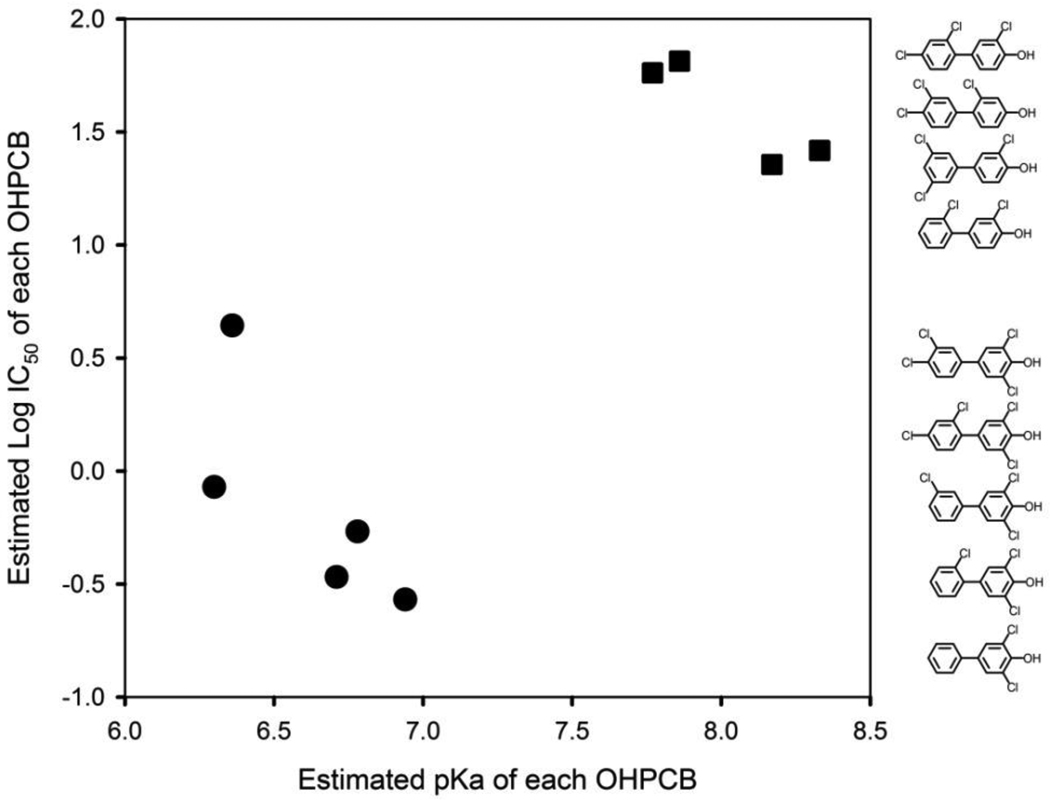
Figure 2.
Relationship between the estimated pKa values of OHPCBs and their inhibition of rSULT1A1. Log IC50 values for rSULT1A1 (with all cysteines in the thiol form) were determined previously [7]. The OHPCBs were divided into two groups, i.e., 4-OH-3,5-dichloro-PCBs (solid circles) and 4-OH-2(or 3)-chloro-PCBs (solid squares). The bivariate mean vectors (pKa and log IC50) in the two groups were significantly different from each other (Hotelling’s T-square test, p = 3.4 × 10⁻⁶). The chemical structures of the OHPCBs are shown in the order of their corresponding IC50 values.

