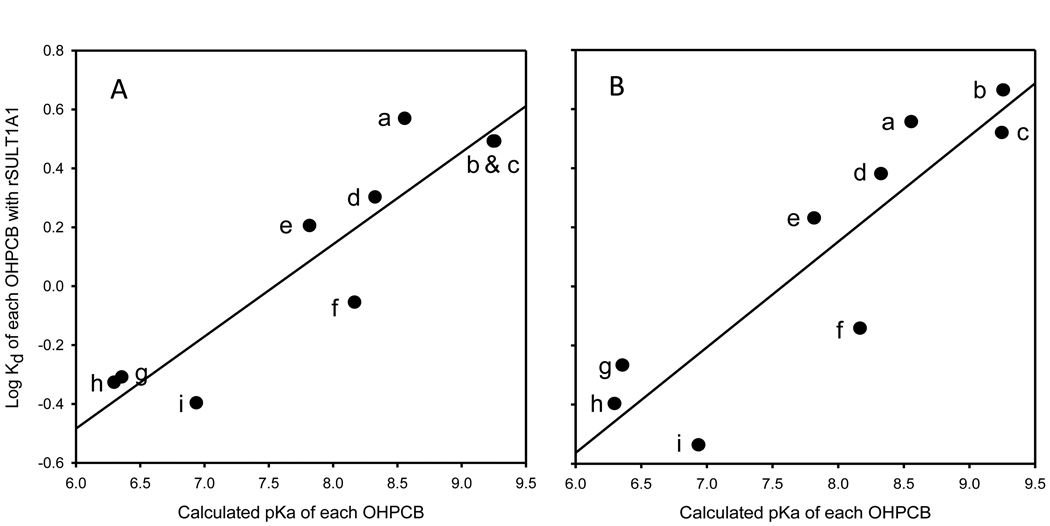
Figure 5.
Relationships between pKa values of OHPCBs and their Kd values for binding to rSULT1A1 under different redox environments. (A) rSULT1A1 pretreated with 1 mM GSH. (B) rSULT1A1 pretreated with 1 mM GSSG. The y axis for panel B is the same as for panel A. The corresponding correlation coefficients were 0.83 and 0.79, respectively. Labeling of data points in both panels: a, 6’-OH PCB 35; b, 4’-OH PCB 12; c, 4’-OH PCB 9; d, 4’-OH PCB 33; e, 4’-OH PCB 35; f, 4’-OH PCB 6; g, 4-OH PCB 34; h, 4’-OH PCB 68; i, 4-OH PCB 14

