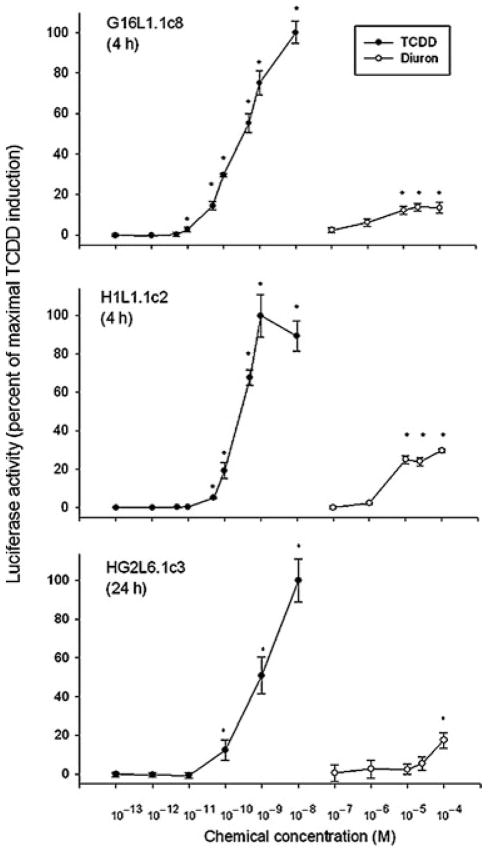
FIGURE 3.
Dose-dependent induction of luciferase activity by TCDD and diuron in guinea pig, mouse, and human cell lines. Guinea pig (G16L1.1c8), mouse (H1L1.1c2), or human (HG2L1.1c3) cells were incubated with the indicated concentration of diuron for 4 h, and luciferase activity was determined as described in Materials and Methods section. Values are expressed in the figure as the percentage of maximal TCDD induction and represent the mean ±SD of triplicate determinations. The asterisk (*) indicates those values significantly greater than the DMSO-treated sample at p < 0.01 as determined by Student’s t-test. Actual DMSO and maximal TCDD induced luciferase activity in relative light units (RLUs) were 24.7 ± 3.9 and 108.1 ± 8.2 in G16L1.1c8 cells, 1.2 ± 0.3 and 49.8 ± 6.5 in H1L1.1c2 cells, and 4.2 ± 0.7 and 126.6 ± 10.7 in HG2L1.1c3 cells, respectively.

